
Duolingo is a rare case. Ask "how much does Duolingo make" and you can get two very different answers, and both are real. The company trades on NASDAQ as DUOL and files audited numbers every quarter. It also sits near the top of the US App Store top-grossing chart, which means you can run it through a chart-based revenue model the same way you would for a competitor that reports nothing.
We put the two side by side here. If you ever plan to quote a chart-derived number for an app with no filings behind it, it is worth seeing how far apart these sit, and why.
What Duolingo reports
For the quarter ended June 30, 2026, Duolingo reported total revenue of $298.5 million, up 18% year over year, in its second-quarter 2026 results. Subscription revenue was $258.0 million, up 22%. The quarter closed with 12.7 million paid subscribers, 58.7 million daily active users and 140.6 million monthly actives. Net income came in at $33.2 million; adjusted EBITDA at $77.3 million.
The 10-Q for the same quarter splits revenue by stream: $258.0 million from subscriptions, $21.1 million from advertising, $10.1 million from the Duolingo English Test, $8.0 million from in-app purchases and $1.3 million from everything else. It also says who collected the money. Apple processed 59.6% of the quarter's revenue, Google 23.2%, Stripe 11.9%.
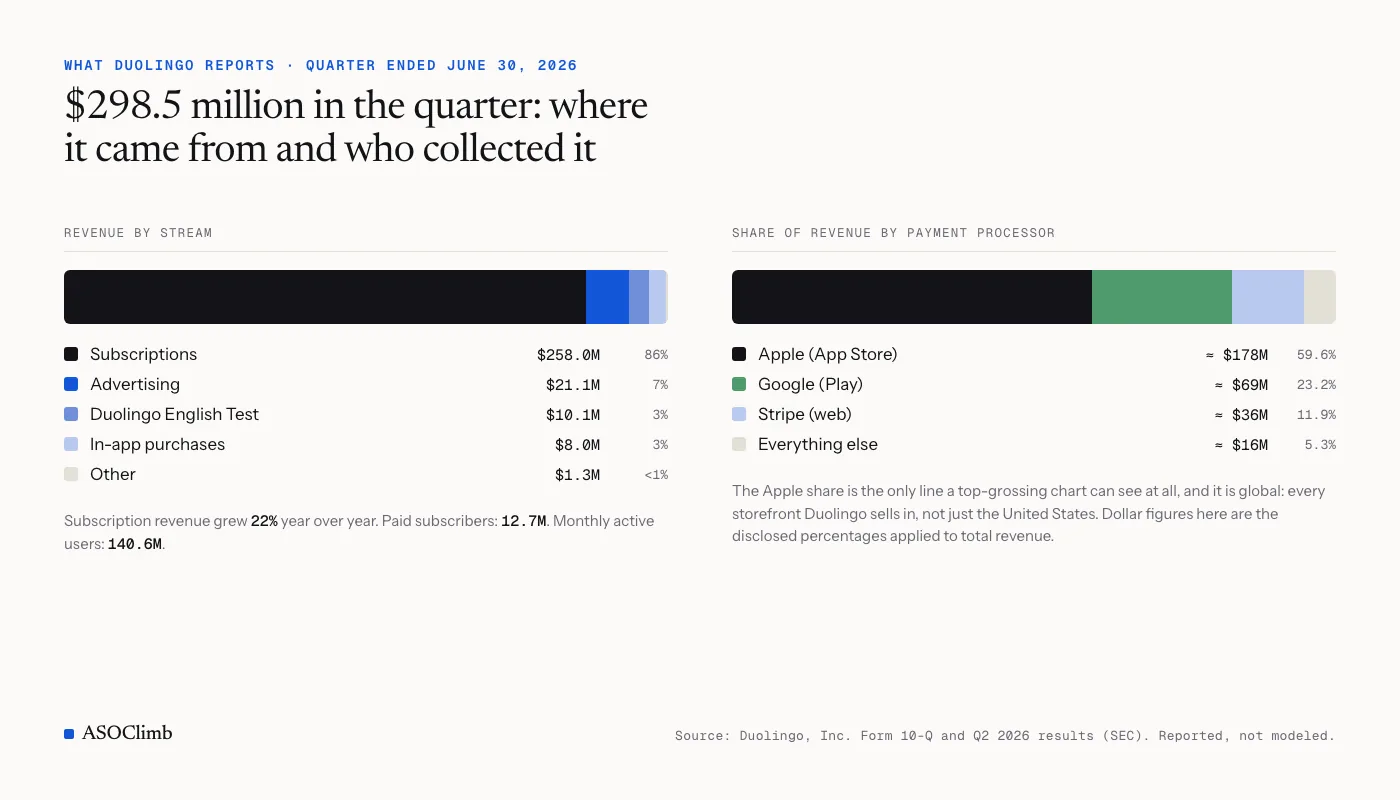
Those are global, all-platform figures, and they are the only reported numbers in this piece. Everything below them is modeled. For the full year the company guided to $1,207 million.
Two things to hold onto. The Apple share works out to roughly $178 million for the quarter, call it $59 million a month, passing through the App Store worldwide. And "worldwide" is doing a lot of work in that sentence: it covers every storefront Duolingo sells in, not just the United States.
What ASOClimb estimates for the US App Store
ASOClimb starts from a different input entirely: where an app sits on the public top-grossing charts, captured once a day. For "Duolingo: Learn Languages" on the US App Store, with 29 observed days between September 27 and October 26, 2026, the model gives:
- Monthly revenue: a range of $7.9 million to $18.7 million, point estimate $13.2 million.
- Monthly downloads: a range of 107,000 to 745,000, point estimate 292,000.
- Confidence: Low.
Read the range, not the point. The point estimate is there to sort rows, not to give you a more precise answer. The methodology page describes the model as a power-law curve fitted to public anchors and averaged over the last 30 captured days. It also says, plainly, that ASOClimb has published no backtest against reported revenue and claims no accuracy figure.
The revenue number is gross: what users paid, before Apple's cut, with no fee assumption applied. It leaves out advertising, web checkout and anything else that never touches the App Store. Refunds and taxes are invisible to the chart, so they are missing too.
The label is Low even though the US is the one storefront with its own anchor for both metrics. The methodology lists what pulls a row down to Low, among them positions seen only on a category chart and rating counts that disagree with the rank signal. Whatever the trigger was here, Low means treat the range as a band and nothing more.
Putting the two numbers next to each other
So: a modeled US App Store range of $7.9 million to $18.7 million a month, against roughly $59 million a month that the filing implies for Apple-processed revenue worldwide. They are not measuring the same thing and they should not match. One is every country; the other is one storefront. Duolingo does not break out US App Store revenue, so there is no reported figure to check the estimate against directly.
What the comparison does give you is a sanity check on the order of magnitude. If the US estimate lands anywhere in its range, the US App Store is somewhere between 13% and 32% of Duolingo's Apple-processed revenue. For a company with 140 million monthly users spread across many markets, that is believable. It is also exactly the kind of check worth running whenever a filing and an estimate both exist.
The other thing it shows is the width of the band. A spread of more than two to one is what a chart-only model produces for a Low-confidence row, and nothing in the method narrows it. Chart position tells you an app is near the top. It does not tell you how far ahead.
How Duolingo compares with the rest of Education
Run the same model across the US Education category over the same window and Duolingo is well clear of the field. The next-highest point estimates:
| App | Est. monthly revenue (US App Store, gross) | Est. monthly downloads |
|---|---|---|
| Duolingo: Learn Languages | $7.9M–$18.7M (point $13.2M) | 107K–745K (point 292K) |
| Learna: Speak & Learn English | $2.7M–$9.3M (point $5.4M) | 61K–576K (point 182K) |
| PictureThis - Plant Identifier | $1.9M–$10.3M (point $4.1M) | 21K–272K (point 73K) |
| Quizlet: More than Flashcards | $1.5M–$8.8M (point $3.3M) | 23K–299K (point 79K) |
| ClassDojo | $1.2M–$7.8M (point $2.9M) | 22K–291K (point 76K) |
| Lingokids: Games & Shows | $1.0M–$6.9M (point $2.4M) | 13K–199K (point 49K) |
| Pimsleur | $1.0M–$6.7M (point $2.3M) | 7K–138K (point 30K) |
All rows Low confidence, 29 observed days, September 27 to October 26, 2026. Modeled ranges, not reported results.
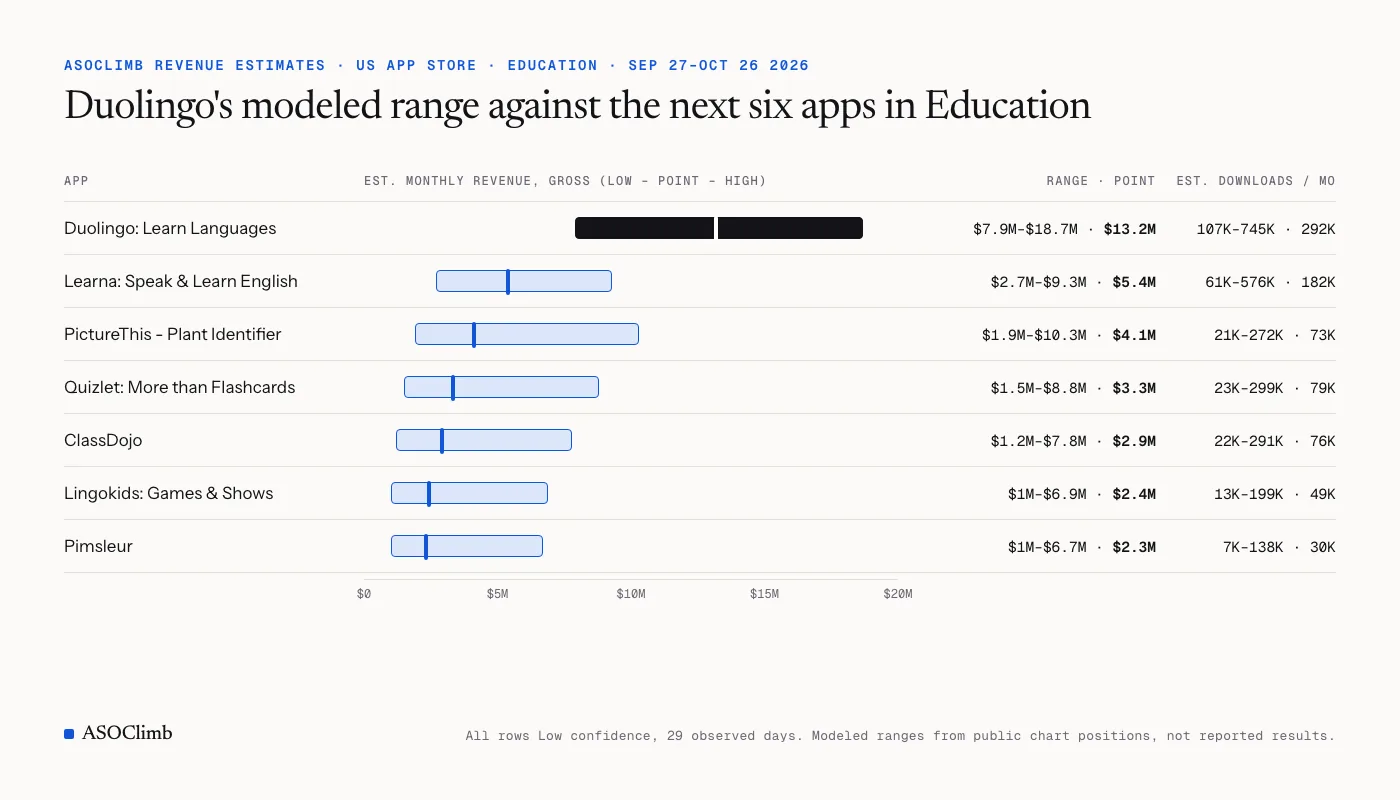
Two things survive the wide bands. Duolingo's low end of $7.9 million sits below the high end for Learna and PictureThis, so the ranges overlap and the model cannot rule out a closer race. Its point estimate is still more than double the next app's. And Education is not just language learning: a plant identifier and a classroom app sit in the top five, which tells you something about where App Store Education money actually comes from.
The download column deserves its own look. Duolingo's 292,000 monthly US downloads lead, but Learna's 182,000 and, further down the list, Gauth's 149,000 are not far behind on a much smaller revenue base. Free charts measure acquisition; grossing charts measure monetization. An app can lead one and trail badly on the other.
Why the modeled number is not the reported number
Every reason the two figures diverge also applies to apps that report nothing, which is why the list is worth writing down.
- Scope. The estimate is one storefront on one platform. Reported revenue is global and includes Google Play, web checkout, ads and the English Test.
- Gross versus net. ASOClimb's figure is what users paid. Duolingo also books revenue before platform fees, with those fees sitting in cost of revenue, so the two happen to be on the same basis here. Many comparisons are not. Check the basis before you put one number beside another.
- Chart behaviour. A grossing chart ranks apps by recent revenue without exposing the revenue itself. The model infers dollars from position, and that inference is only as good as its anchors, which are dated and few. How app revenue estimates are made from chart ranks walks through where the uncertainty comes from.
- Timing. The filing covers April to June. The estimate covers late September to late October. Paid subscribers grew 17% year over year, so the two windows are not quite the same business.
None of this makes the estimate wrong. It makes the estimate what it is: a modeled range for one storefront, derived from public chart positions, with its limits stated.
What to do with a number like this
If you build in Education, the practical read is short. The leader's US App Store revenue is somewhere between high seven and low eight figures a month, the second tier is in the low millions, and the gap is not closing inside a 30-day window. That is enough to size the category. It was never going to be enough to plan a budget against.
If you are estimating a competitor that does not file with the SEC, Duolingo is a handy calibration case. Where a filing exists, the model's range holds a plausible share of the reported figure. Where none exists, you get the range and nothing to check it against, so write down the scope, the date and the confidence next to the number. The free workflow for estimating competitor revenue covers how, and what the result cannot tell you.
Check any app for free
ASOClimb's free plan includes Revenue Estimates for any app on the App Store or Google Play charts, with range, point, confidence and observed days shown together. No card needed. Open Revenue Estimates after signing in, or see what the free plan includes.